Fire Resistance Tests: Part II. Time-temperature curves
Actualizado a fecha: 2 December, 2018
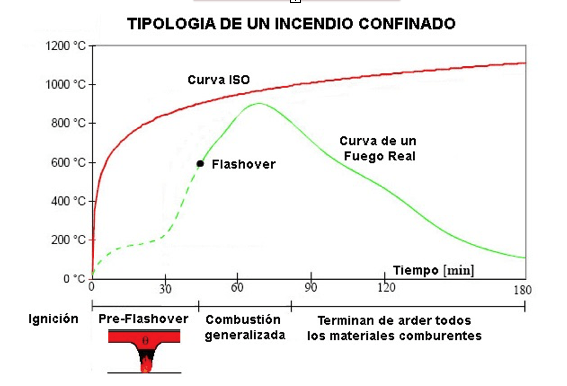
The time-temperature curves are mathematical formules that regulate the temperature in a test furnace as a function of time. Its function is trying to assess and compare the different behavior of the building materials in the same fire scenario.
The most common to assess building and industry fires is the Fire Curve ISO 834 Normalized or Cellulic created in 1975. Contrary to the usual belief, this curve does not attempt to mimic a real fire scenario (since they are of a very variable nature due to the multitude of combustible materials, ventilation, etc.) but it allows a comparison of the fire behavior of different basic building elements and thus establishes a relative classification, a hierarchy in relation to a reference fire easily reproducible in the laboratory with the following formula: (t = time in minutes)

This ISO complies with the two necessary requirements (always increase), which allows us to arrive always at the collapse of different construction materials to establish comparisons being more demanding than most of the usual fires.
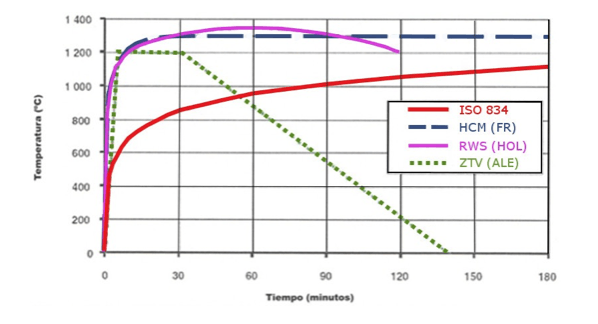
Experience has shown that there are some scenarios in which this ISO curve is insufficient, as much as by the maximum temperature reached, as by the speed in reaching a certain temperature. For example, a fire in a Tunnel can reach temperatures of more than a thousand degrees in few minutes. Below, we make a comparison of the most common fire curves in tunnels in different EU countries compared to the ISO curve:
The most demanding, called “Rijkswaterstaat” is known as RWS. It is used in Holland and reaches 1,300 degrees Celsius in 30 minutes, being also important theHCM or Greater Hydrocarbons Curve because it is demanded in France for Steps of tunnels The Germans use the ZTV.
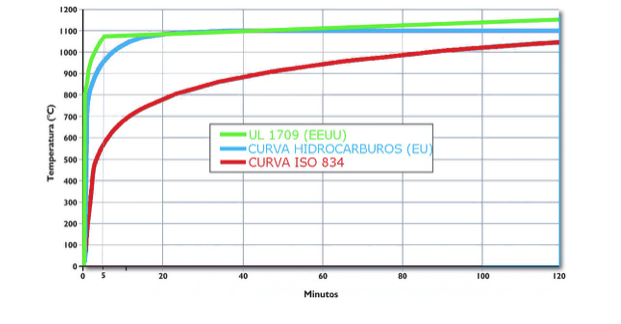
The Petrochemical Industry also uses other types of fire curves, due to the type of fire that can be produced. The two most common are: European Hydrocarbons Curve HC and American UL-1709.

